Lessons Learned from Last Week's S3 Outage
Like many companies, we were affected by last week's S3 outage. We were surprised, however, by the extent of the impact to our systems. It was a bit ...
2019 was a big year for the HubSpot Product team: we committed ourselves to providing our customers with a faster, more reliable experience across our entire product. The mission had a catchy name, 'Make HubSpot Fast', and had steadfast support from both Engineering and Product leadership. While HubSpot apps have had internal availability and latency Service Level Objectives (SLOs) for years, the percentage of apps meeting those SLOs had begun to decline over time. Teams cared about performance, but there was no framework in place for them to prioritize meeting these SLOs over their other customer-focused work, particularly new feature development. To deliver HubSpot customers a faster, more reliable experience, we created the Frontend Performance and Monitoring team, responsible for providing relevant guidance and tooling for teams to Make HubSpot Fast.
HubSpot Product & Engineering has structured itself around a set of core values, like "Think Like an Owner" and "Small Teams Win." These values translate into our small, autonomous team structure, and our microservice architecture. We have 150+ different teams that own thousands of individually deployable backend and 400+ frontend applications that make up HubSpot's product offering and internal tooling. Most of our teams are entirely composed of engineers who work on either the backend or frontend, allowing them to be fully focused on that part of the stack. These teams build Single Page Applications in React, using a shared library of components from the HubSpot Canvas Design System. These applications are then built by our homegrown frontend build tooling. Even though we have hundreds of packages, our teams are using the same stack and foundation, which allows the Frontend Platform group to provide regular updates, upgrades, and guidance for everyone.
Tracking the performance of Single Page Apps can be difficult, as they are rendered client side and usually depend on async data. Since they're not simple static pages, we can't rely on more traditional timing data such as onload or DOMContentLoaded. Without a metric that we could use directly off the shelf we set out to track the data ourselves. We came up with the idea of a “Time to All Success” metric that would measure how long it took for the page to render successfully.
We initially tracked our Time to All Success by having teams specify CSS selectors that should appear on the page when it rendered correctly and CSS selectors that would show up if there was an error. The library would then poll the page for these CSS selectors and once all the success selectors showed up on a page, it would consider the page fully loaded. In the case of an error selector showing up, the page was instantly marked as a failure. We also had a timeout of 60 seconds, and if nothing showed up in that time we also considered that page to be a failure. While this solution served us pretty well for years, it wasn't built for our React stack and had some major pitfalls as a result. First, it was easy for a code refactor to unintentionally remove the CSS selectors used for tracking, causing pages to start failing. Second, it was easy to accidentally “cheat” these checks by having checks defined deep within code splits that may have failed to load. To address these drawbacks we set out to build a new solution.
For our new system we set out to build something that would hopefully fix some of the issues we saw devs hitting while also still reporting the same metric data we had before. Our second iteration starts with a static configuration file; this file includes a list of all the routes in an app, and which primary components (or "NavMarkers") are expected to show up for a given route. With this static configuration, we will know all of the routes in an app at and after build time. Then, developers can render simple React components, "NavMarker," with specific names in their code. These NavMarker components can be static analyzed and are a little more obvious when they get removed due to a refactoring than the previous version’s CSS selectors. Another added benefit of having this static configuration allowed us to build out app health checks that automatically load all of the routes in an app to ensure they are loading properly—something we couldn’t do with the dynamic nature of the previous solution.
The timing data collected by these tools are then sent off to New Relic, a monitoring and metrics platform, and within New Relic we track Availability and Latency scores for all of our apps. For Availability we look at the number of page loads that happened over the time period and then calculate the score with `Successful / (Successful + Failures).` Teams need to have a score of >= .99 to pass.
For Latency we use the Apdex score for each app. The Apdex is calculated by grouping users’ experiences into three categories based on a threshold, “T.” In our case “T” means the ideal time it takes for the app to load. Historically, we used a T value of three seconds. With that in mind, we divide all users into these three buckets based on the “Time to All Success” metric data we collected earlier:
Then we calculate (Satisfied + .5 Tolerating users) / (Satisfied + Tolerating + Frustrated) which needs to be >= .9 to be considered passing.
Given that many of our teams weren't meeting the Latency SLO with a T value of three seconds, we did the logical thing: we made it even harder for them, lowering the threshold further to be a T value of two seconds. While we could have stuck with three second threshold and had plenty of work to do we knew we could do better, and we wanted everyone to hold our product to a higher standard. This drop from three to two seconds also changes the buckets of tolerating and frustrated users. The buckets now look like this:
And yes, changing that T value from three seconds to two seconds was a bit arbitrary. In the end, it was a gut feeling about where we wanted our user experience to be and what we thought was possible given our infrastructure and our stack. This change wasn't met with much pushback from teams, as many were already missing the SLO anyway. But of course, there was some healthy skepticism concerning if the two-second bar was even reachable.
We also tweaked which page loads were counted in both the Availability and Latency SLOs page load numbers. When looking at the distribution of page load times, the vast majority of the upper 90th percentiles were pages that weren't always "visible." By visible, we mean focused in the foreground of the browser. To track this, we listened to the “visibilitychange” event, and if the visibility state of the page ever changed from “visible” to “hidden,” we ignored the timing data from that page load. Doing so made sure that all page load data was equivalent and we weren’t trying to fight against browsers that deoptimized background tabs and page loads.
With our new SLO definitions in place, we set out to give our teams a better view of their app’s performance in a repeatable synthetic environment. The goal was for teams to be able to iterate on their app's performance and see improvements when we reduced the variables of which computer or network was being used, or what async data was being loaded.
To do this, we built an integration with a 3rd party vendor, SpeedCurve. SpeedCurve provides insights into page load performance via automated WebPageTest runs. With this integration, every pull request that is opened for a project is automatically tested by SpeedCurve. This is powered by our “Branch Previews,” where each build of every application is immediately available to use as if it had been deployed to QA. After each pull request is opened, inside SpeedCurve we can compare against the currently deployed version of the app and look at metrics such as our “Time to All Success” that we calculated earlier, and the size of assets (HTML, JavaScript, CSS, images) while loading the page.
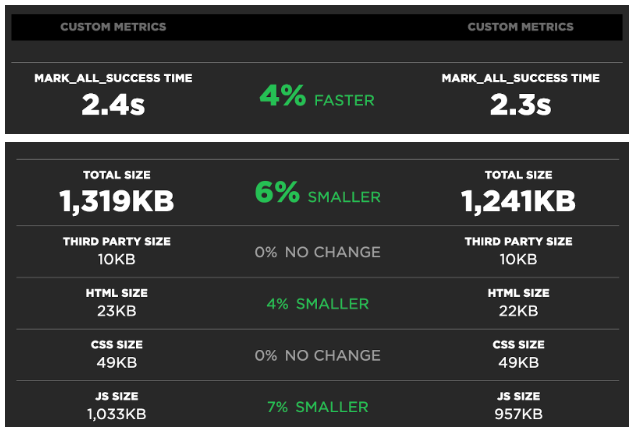
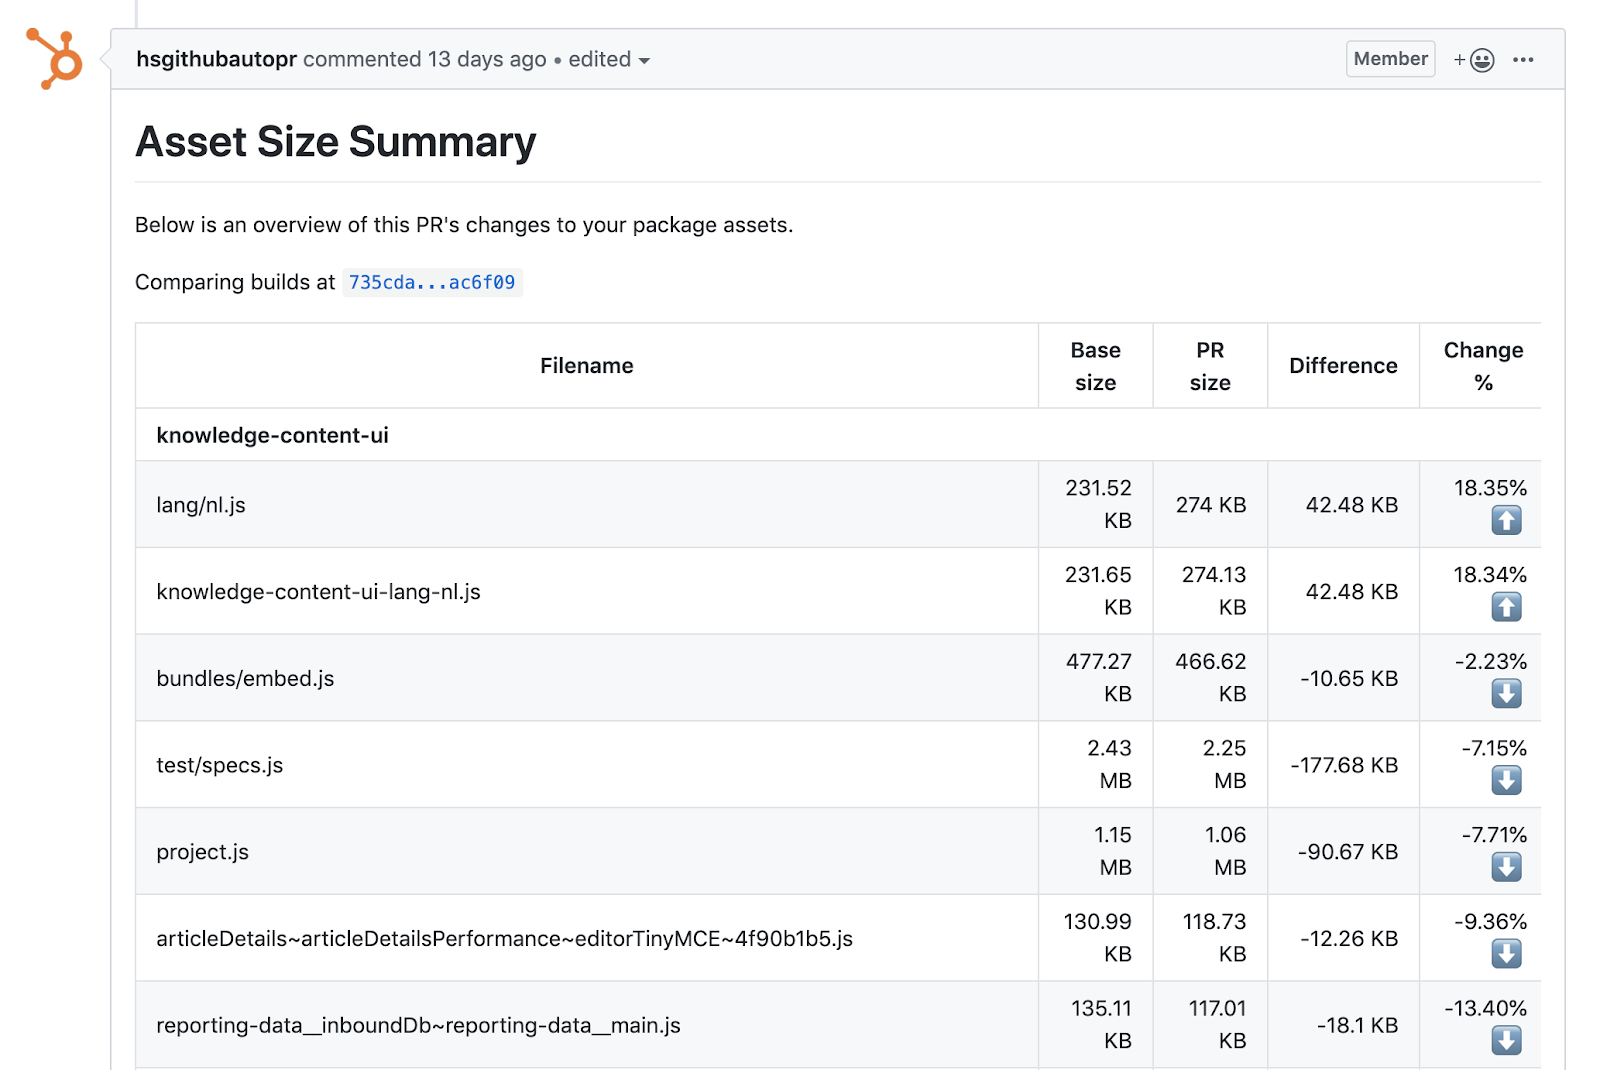
Alongside the SpeedCurve tests we also calculate the sizes of all assets in each project and compare them against the primary branch. This way we can see the net change in asset sizes across branches and also track when new assets were made or lost due to code changes. This serves as a sanity check for when a new dependency or feature is added and it increases the size of the bundles in the app.
With the help of the other Frontend Platform teams, the Frontend Performance and Monitoring team shifted focus to providing some more infrastructure-level improvements to help teams pass their SLOs. We started experimenting in a few different directions: we upgraded Babel, created some tooling and guidance for code splitting, set a deadline to upgrade to React 16, and made a new bundle that we call “hubspot-dlb”.
One of our first experiments was upgrading Babel from v6 to v7. Babel converts code written in ECMAScript 2015+ (ES6) back to the more supported ES5 version for cross browser compatibility. Once we were on v7 we also worked to externalize the Babel runtime. Externalizing the Babel-runtime allowed us to reference only one copy of all of the Babel runtime helpers instead of the code being added to every JavaScript module in our builds. This change accounted for savings of around 5-20% in bundled JavaScript code depending on the size of the modules. Which amounts to hundreds of kilobytes of JavaScript that no longer needed to be parsed at runtime. This was something we could turn on for all teams without any code changes on their side.
Code splitting was also something we quickly worked on to provide some more guidance and tooling around. First, the Frontend Platform teams worked closely with the UX team to provide some user experience guidelines for how loading states should work, taking into account perceived performance. The result event went so far as providing a few different loading components based on different scenarios and how they should show up on the page. We looked at this problem from a UX perspective instead of just a pure performance one because a page that jumps around as it loads in or shows multiple loading spinners is a poor experience even if it’s “fast” according to the metrics. We built a “UILoadable” component that enforces this well-defined experience for when to show a loading indicator and ensuring there is a failure state if there was a failure for any reason.
As we have hundreds of apps at HubSpot, not all of them get the level of attention that they may need to stay up to date, which leads to a bit of a dependency version lag. This also means that our core dependencies, like the components in the HubSpot Canvas Design System, need to work with the multiple versions of React. Because these older apps were holding us back, we set a deadline for all apps to migrate to React 16 by December 1st, 2019. While it took a lot of work, we were able to eventually get all apps on React 16 a month before the deadline. With all apps on the latest version of React 16, we unlocked some core upgrades for our design system such as hooks and Suspense while also upgrading other outside dependencies such as styled-components and react-router to build even better user experiences.
With a core stack that is shared among all of the apps, we set out to extract the same core of our apps to a single bundle, called the hubspot-dlb, that we could share across all of our apps and increase the cache hit rate for. The hubspot-dlb or Dynamically Linked Bundle is a concept that we built that is similar to the Dynamic Linked Libraries (DLLs) in webpack and Microsoft Windows. We found that when users loaded a cached version of our apps, they would load over a second faster than cold caches, which is enough of a speedup to get more page loads into the satisfied group. This speedup was seen even if just the hubspot-dlb bundle was cached and the app code wasn’t. To start, we included react, react-dom, redux, styled-components and ImmutableJS. These libraries are large, rarely change, and are core to all apps built at HubSpot, making them great candidates for a meaningful and long-lasting bundle.
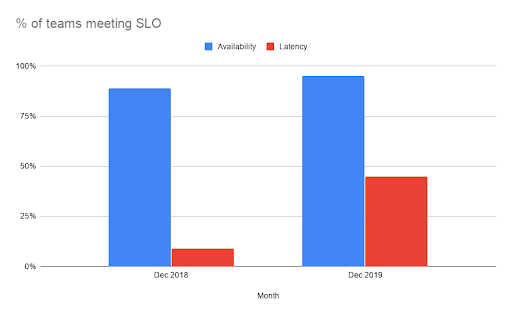
With these changes and the big push to Make HubSpot Fast in 2019, HubSpot Product & Engineering has made great progress. We started 2019 with 11% of teams failing to meet the availability SLO (>= .99) and ended 2019 with 5% of teams not meeting SLO. On the latency side we started 2019 with only 9% of teams meeting the SLO of >= .9 which we were able to increase to 45% to start 2020. We're proud of these improvements, but we still have work to do to get to 100% for our customers.