Saving Millions on Logging: Finding Relevant Savings
In tech companies, Cost of Goods Sold is a key business metric driven in large part by the efficiency of software architectures. Saving money always ...
In tech companies, Cost of Goods Sold is a key business metric driven in large part by the efficiency of software architectures. Saving money always sounds like a great idea, but it is not always a priority over features and growth, nor is it straightforward.
At HubSpot, our relatively new Backend Performance team is tasked with improving the runtime and cost performance of our backend software. In this two-part blog series, we will look at a structured method we use for approaching cost savings work and demonstrating how we apply it at HubSpot to save millions on the storage costs of our application logs. Miss Part One? Read it here.
_________________
In our last post we looked at the planning stage of a cost savings project. Starting from discovery via metrics, we looked at an example of tracking down a high cost area in our AWS Cloud spending, formed a hypothesis of how we might reduce cost, and ran preliminary measurements to estimate the impact of the work.
In this post, we will run through the details of the design and implementation of the cost savings. Then we will quantify the results of the project and tie it back to the broader framework for approaching cost savings projects and why you might want to work on these types of projects.
Lifetime Retention of Log Files
One vector for reducing the cost is storing the files for less time. In large and complex software ecosystems, maintaining every configurable element of the system is a daunting task. Configurations can easily decay from original intent or become outdated by subsequent changes.
When we reviewed the lifetime retention of our log files in our S3 buckets, we realized there was a disconnect between how long we stored the same files in ORC and JSON formats. We stored ORC files for 460 days, but raw JSON files for 730 days, almost 60% longer.
Revisiting how log files are used. In terms of volume, engineers are running about 2,200 log queries a day. Of these, the most common use case is looking at very recent logs to triage and diagnose active issues. Occasionally a regression is found that has been deployed for weeks or months, in which case more historic log data becomes useful. In very rare cases we might have a regression that is 6+ months old. What the use cases do not point at, is needing data from nearly 1-2 years ago.
With a simple review of our AWS bucket lifecycle configurations, we’ve just identified that we can lower the TTL of our raw JSON logs data, removing 63% of the days of logs.
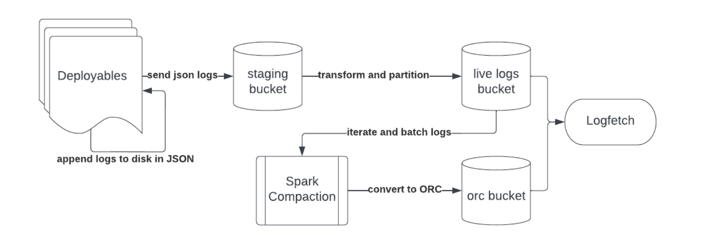
Our logs are appended to disk in JSON by our Java deployables. Processes on our hosts then periodically rotate the log files and upload the rotated files to a staging bucket in S3, with very short retention policies.
We use an S3 event listener to track new files added to the staging bucket, apply some light transformations, and partition the data by date and deployable into our live-logs JSON log bucket.
Logfetch, our internal log searching tool, layers on top of AWS Athena to perform log searches against the data in the live-logs bucket, as well as a secondary bucket, the compacted ORC bucket.
The ORC bucket is populated asynchronously via a Spark worker. The Spark worker iterates over the last 7 days of JSON data in the live-logs bucket, looking to merge and convert JSON files to ORC files. It does some grouping logic to make sure it keeps data partitioned within the same day and it merges small logs files into a single larger, more uniform ORC file size.
However, we face much stronger headwinds having an existing, massive ecosystem of applications. The biggest challenge is that writing to ORC requires pulling in a large chunk of the Hadoop dependency ecosystem, notoriously painful for version management. Trying to shoehorn in ORC conversion into all our Java applications means getting the Hadoop dependencies to coexist peacefully with our already complicated dependency management landscape. Our other option would be to fork the ORC conversion code and replace the used Hadoop library functionality with our own implementations. But maintaining a fork of ORC and some Hadoop has high operational overhead.
After Writing to JSON
We could convert to ORC after we write the JSON data to the live-logs bucket in S3. However, we can see this is already the design implemented, but it does not keep up with log volume. It may still be possible we can find some runtime performance wins to speed up this process and keep up with the growing scale of log data.
After Staging to S3
We do have one other place in the data flow to consider. We could write to ORC at the stage where we transform the raw log data into our searchable format, and apply the partitioning by date and deployable. This avoids the dependency issues of writing it directly from our deployables and it also avoids the aggregation costs of doing it after partitioning.
After further investigation, we actually already have configuration and functionality to convert to ORC after staging, but we need to address why we haven’t been.
Revisiting Assumptions
Assumption: Too Many Small Log Files Slows Log Searching
Sometimes assumptions are based on conditions that have since changed (for example, in a past role an underlying data source migration that now allowed queries to return ordered results meant we could avoid a very expensive spark pipeline and instead do a streaming merge in memory). And sometimes assumptions can be made without thorough measurement proofs or the system has changed enough that the metrics also change.
Tying back into the project at hand, a key design assumption of the system was that searches will perform poorly against many small files for lower throughput services. And therefore we need to do the more computationally expensive operation of merging files within day boundaries.
This assumption then leads to preferring post-compaction from JSON. However, as we reassess this design, we can see that the materialized reality has drifted a bit. In an ideal world where all files are compacted to ORC, you realize the benefit of merging the files for those services with smaller volume while getting the full benefit of ORC for the services with larger log volume.
But if we recall, compaction is only keeping up with compacting a fraction of the log data at 30% compacted. And this is also skewed towards smaller apps versus larger ones because it does compaction one batch at a time in round-robin by deployable. So small apps get most or all of their logs compacted while large apps only get a small fraction compacted.
The impact then is that the design choice inherently also carries the decision that request and application logs for high volume applications will not be compressed to ORC.
Invalidating Assumption
We need to validate that the cost of low compaction rates on high throughput services is worse for performance than the small files problem on low throughput services. We ran queries in Athena against the same log data in JSON and ORC conforming to these use cases.
For the high throughput use case, we chose a query searching for non-existent field equalities in the where clause. This will require checking all the data for matching rows. This query took 34.5 seconds to run against 268.55 GB of JSON data. Meanwhile, the same data occupied 9.81 GB as ORC and took 3.9 seconds to complete. Having less data to scan plus the ability to leverage stripe level indices allow ORC queries to go an order of magnitude faster.
Meanwhile, comparing the query times of the same data in a few ORC files versus thousands we saw slightly better performance for the merged ORC files, but the overall data volume is so low that both queries return quickly. It doesn’t appear that an underlying high file count yet low data volume will have a negative impact on user experience during log searches.
Current Performance
We can start by analyzing our current compaction process to see what its performance characteristics are. Analysis shows it is able to convert about 28-42 TB a day of the trailing 7 days of request log data. If we take this at face value with an average daily volume of 35 TB, it would take us 907 days to convert 31 PB of JSON request logs to ORC.
The compaction job has to do some expensive grouping/reduce operations within Spark as it tries to merge the ORC files and also partition them by day. This manifests in inefficient runtime performance. For example, 6.4GB of JSON logs took 3.3 minutes to shuffle, plus an additional 6.3 minutes to write to both HDFS and the ORC bucket. It also seemed to scale non-linearly down to smaller data sizes. A 10.8 MB set of log data took the shuffle and write operations 42 seconds to complete.
Streaming Solution
Leveraging past experience with rewriting Spark jobs as in-process streaming applications, we bet that we could achieve much higher performance than the existing compaction job. If we recall from earlier when we were comparing performance of converting raw logs to JSON and ORC, we were writing 122MB raw log files to either format in about 1 second. This serves as a guiding benchmark as we compared against the current performance of the Spark jobs we just looked at.
To build out a fast streaming conversion design, we wrote some custom serialization code and leveraged some key S3 features.
The staging phase from raw to searchable logs involves a few transformations on the keys and data of the raw log files. Our current pipeline looked something like: Parse JSON to the gson Java library data type, re-parse the gson data to lower-cased field keys, then convert to ORC. Our implementation used the Jackson JSON library (personal preference and more commonly used within the company). We wrote a Jackson -> ORC writer, allowing us to eliminate the second lower-casing phase of JSON parsing.
To make streaming the data in a fixed memory Java application viable, we fed an S3 input stream of the JSON data in batches to the ORC writer. We implemented an S3 ORC writer that uses multipart S3 uploads to flush the batches to S3, and then finally completed the multipart upload once a file finished streaming.
The results were satisfying. A single application running the streaming setup with 14 CPUs and 7GB of heap space is able to convert 20GB of data per minute. Our daily log volume is about 140TB, so roughly 5 instances would be able to keep up with a day of logs. Since the application is self-contained we could scale horizontally to whatever size we need to work through converting the 460 days of existing request log data.
As part of the backfill, we leveraged a newer custom event logging pipeline written by the HubSpot logging team. This allowed us to define a simple schema for each file we converted in the backfill along with information about the data sizes and remaining costs. Using this data source, we wrote a single Athena query aggregating accurate metrics for the backfill.
Scaling to 140 instances of our streaming backfill workers, we converted 34.7 PB of JSON logs into 1.47 PB of compressed ORC logs, achieving a 4.24% compression rate. The total runtime of the backfill was 8 days 8 hours and 22 minutes.
We also flipped the configuration to convert staged request logs to ORC instead of JSON, skipping writing any data to the live-logs JSON logs bucket.
One-Time Backfill: Cost Breakdown
Net Savings: 7 figures (12.8% above estimate)
One way to break down the cost savings is to look at the delta for the remaining cost of the files that were converted. The remaining cost of 34.7PB of JSON logs (until their lifecycle TTL deletion events) reached 7 figures more than the remaining cost of the converted ORC logs. We also saw a modest 6 figure savings from our initial change from 730 days of retention to 460 days (this number is lower than you might expect because we used to have a higher ORC compaction rate, and had less JSON logs in this range). We took on some one-time costs to perform the backfill, of which the biggest was the extra costs to read S3 files from the Infrequent Access storage class, which cost about 5% of the total savings. The actual S3 Get, Multipart Upload, and Delete API requests were an insignificant cost at 0.13% of the total savings. Likewise, the server resource costs were negligible during the backfill.
Yearly Projected Savings: Cost Breakdown
Perhaps a more useful breakdown is the impact on yearly costs. Those tracking expenses and costs typically don’t have a great way of quantifying “the one-time cost savings of the lifetime of a wide array of various S3 files aging out gradually over time” into something usable for quarterly and yearly planning.
To get the estimated yearly savings, we instead look at the monthly costs of the JSON and ORC S3 buckets. Our average monthly JSON logs cost was reduced by 55.7% (this includes other logs types we did not include in the project). Meanwhile, our ORC bucket cost grew 3.2x, with an overall cost at 6.4% of the prior JSON log costs.
When we trend out the cost changes per bucket before and after our implementation, we get 7 figures in yearly cost savings.
User Experience Improvements
Beyond cost, we also realized performance wins to our engineers’ user experience of searching logs. On particularly powerful comment from an engineer working on one of the highest throughput services at HubSpot stated:
“LogFetch is now BLAZING FAST. Request log queries for my service used to take 30 minutes or more per day of logs queried, and I just ran one that completed in 36 SECONDS”
Bigger Picture
Software and priorities evolve over time, leaving opportunities to revisit assumptions in our architectures to achieve lower costs and better performance. Keeping Costs of Goods Sold down on the balance sheet is always important for any business to thrive, especially in a volatile economic climate like 2023.
Not only are cost-savings projects great for a business, they are a good way to grow your career as a software engineer as well. Cost savings projects read well on resumes as they bring quantifiable outcomes to projects. A lot of times it can be hard to quantify the important work an individual engineer delivers to end users or the bottom line finances at a company.
Furthermore, cost-savings projects help provide fixed constraints and are a good way to technically challenge yourself. Yet, cost-savings work doesn’t always have to be highly technical or challenging at all. A lot of cost-savings can be found in the dusty corners of configuration and cloud provider settings. For example, think back to the TTL retention settings on our log files.
Review
So cost-savings sounds like a great initiative, but how can you get started? I hope the case study helped outline the steps to approaching cost savings, and let’s revisit the steps.
First we need to drill down into the dimensions of high cost areas. Perhaps it’s an HBase table that makes up the majority of my team’s costs.
Once we’ve identified this high cost area, we then recheck our assumptions about the design and do some measurements of what could be changed. Maybe we are keeping around a lot of extra versions we don’t use on our HBase rows. Or maybe we wrote more data and have extra columns that we never end up using, and we could write 25% less data with a reasonable change. These are made up examples for ease of discussion, of course each analysis will be unique.
Equipped with a hypothesis for a reasonable change, we can start digging into potential cheaper designs without sacrificing significant functionality. And once we come up with a decent design proposal, we can assess if the estimated cost savings and the engineering effort justify follow through. Finally, we execute the project and assess our costs and savings so we can present the results!
Interested in working on challenging projects like this? Check out our careers page for your next opportunity! And to learn more about our culture, follow us on Instagram @HubSpotLife.