It's Never a Hardware Bug, Until it is.
Edit, April 30 2026: The OpenJDK now contains a mitigation for the hardware bug described in this article, which will appear in OpenJDK 27. Thank you ...
Studies at Google and Amazon have shown that even 100ms of extra load time can have a dramatic effect on your conversion rate. So how fast is your site?
You can measure it on your computer using Chrome DevTools or YSlow, but how fast is it on your user's actual computer or mobile device? It's not hard to find out.
Now that the APIs are available, there is no reason to not be monitoring web app performance from the client. The data you get reflects the experiences of your actual users, not some artifical testing environment, and it doesn't require a complex virtualization environment. In just a couple lines of code you will have powerful analytics you can use to optimize your site and to ensure your performance doesn't regress.
If you have a tool for monitoring client-side performance not listed here, please let us know.
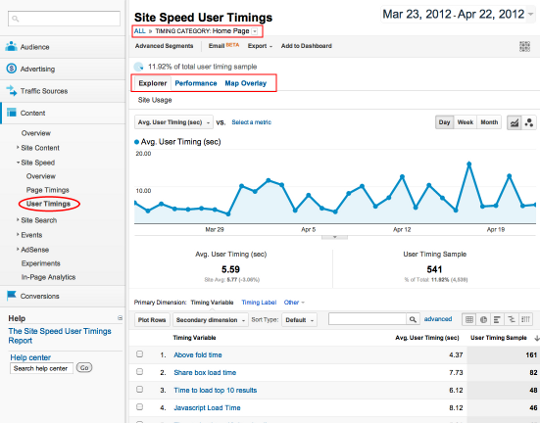
Google Analytics provides an API which can be used to manually track how long a javascript task takes.
For example, to track how long it took for an ajax request to complete:
var startTime = new Date;

$.ajax({
  url: 'some/url',
  success: function(){
    var elapsedTime = new Date - startTime;

    _gaq.push(['_trackTiming', 'some/url Load Time', elapsedTime]);
  }
});
Tracking all of the requests your page makes is possible by wrapping the XMLHttpRequest object. It's also a good idea to use performance.now(), rather than new Date, when possible, and you'll need a way of turning urls into meaningful keys. Take a look at a tool like Bucky for a proven example.
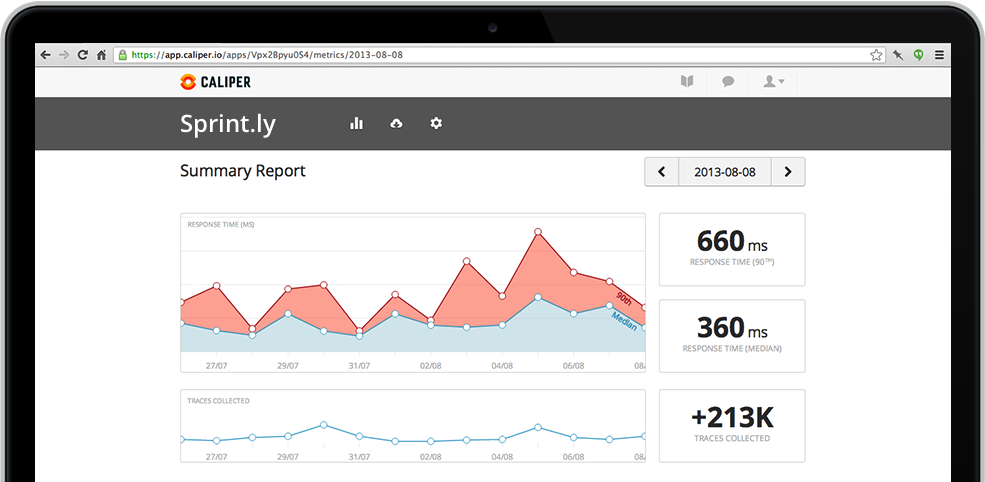
If you use Backbone.js or Ember, there is a paid service called Caliper.io which can automatically measure the performance of parts of your app.
Caliper works by hooking into the routes your user navigates to and the events you bind onto views. Whenever an event or route is triggered, it sends the time to the Caliper servers.
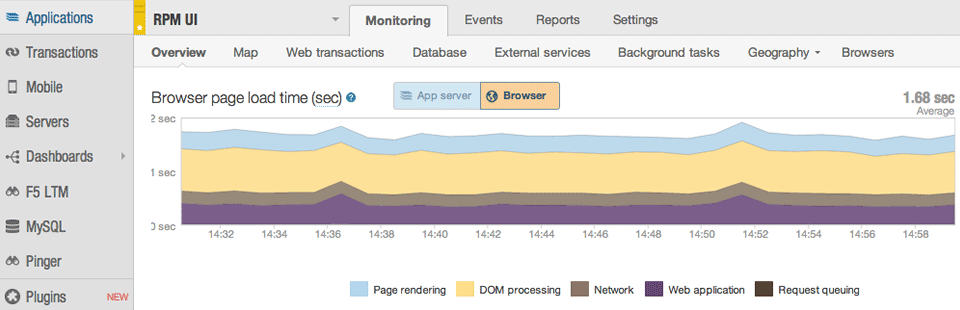
New Relic is a paid service which can do general monitoring of your servers. Part of their offering is what they call 'Real User Monitoring' which measures client-side performance. Real User Monitoring is enabled by inserting a javascript file (or instructing New Relic to insert it for you). Take a look at their FAQ for more detailed instructions.
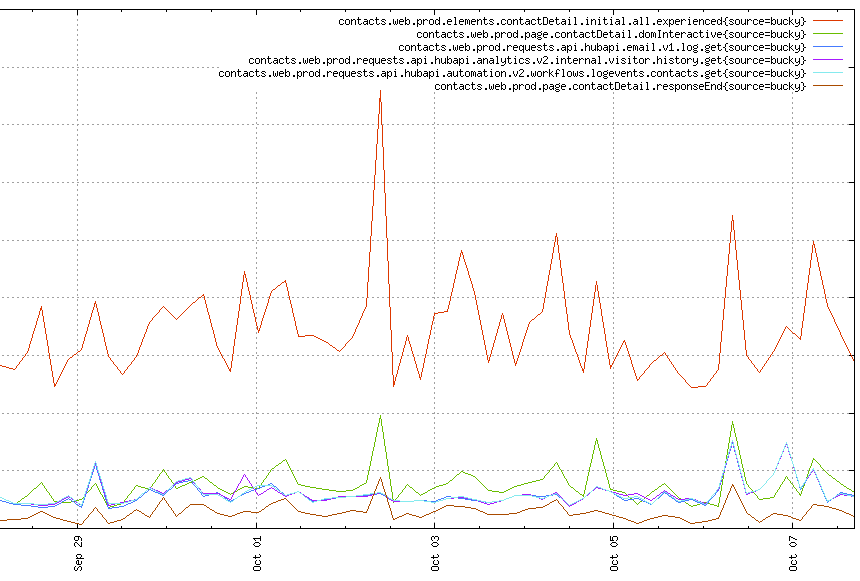
We at HubSpot built a tool to push performance data from the client into Statsd or OpenTSDB. If you are using one of those tools to monitor your server-side performance, it might be a good idea to add Bucky to monitor your client-side performance.
Drop one script tag in, and it will send data on every page load and AJAX request to your monitoring tool. You can also manually monitor any javascript using Bucky.
Bucky is the only open-source and self-hosted service on the list, so far.