Preventing Serial Processing on the Import Pipeline
Written by Yash Tulsiani, Technical Lead @ HubSpot. The HubSpot import system is responsible for ingesting hundreds of millions of spreadsheet rows ...
Apache Kafka is an integral part of our infrastructure at HubSpot. We often have long pipelines of workers that consume from and publish to Kafka topics. A great example of this is our Sidekick product which delivers real-time notifications to users when a recipient opens their email. Much of the infrastructure for creating and delivering these notifications is built on top of Kafka.
The Sidekick notification pipeline looks roughly like this:
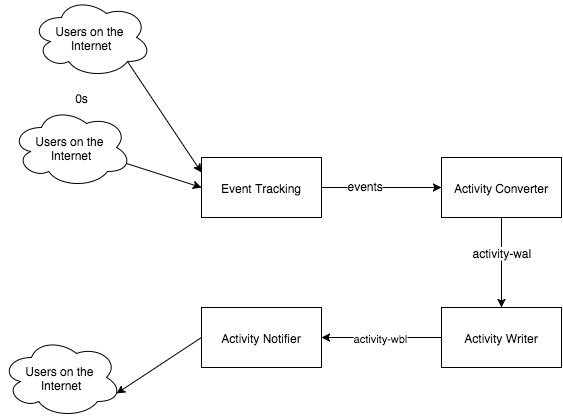
Having many Kafka consumers chained together like this raises some important questions: How do we monitor performance of each consumer, and for the system as a whole? How can we tell if our consumers are healthy, and if they aren’t, how can we quickly track down issues in the system?
I’ve found two metrics that are crucial to answering these questions.
We have a concept at HubSpot called “delta” which we use to determine if a consumer is keeping up with data on the topic.
So what is delta? In Kafka, each message is sent to a partition on the topic. Messages on a partition are given increasing offset numbers as they are written. As a consumer consumes data it tracks the offset of the last message it has consumed. Delta is the difference between the consumer’s checked in offset, and head (latest offset) of the partition:
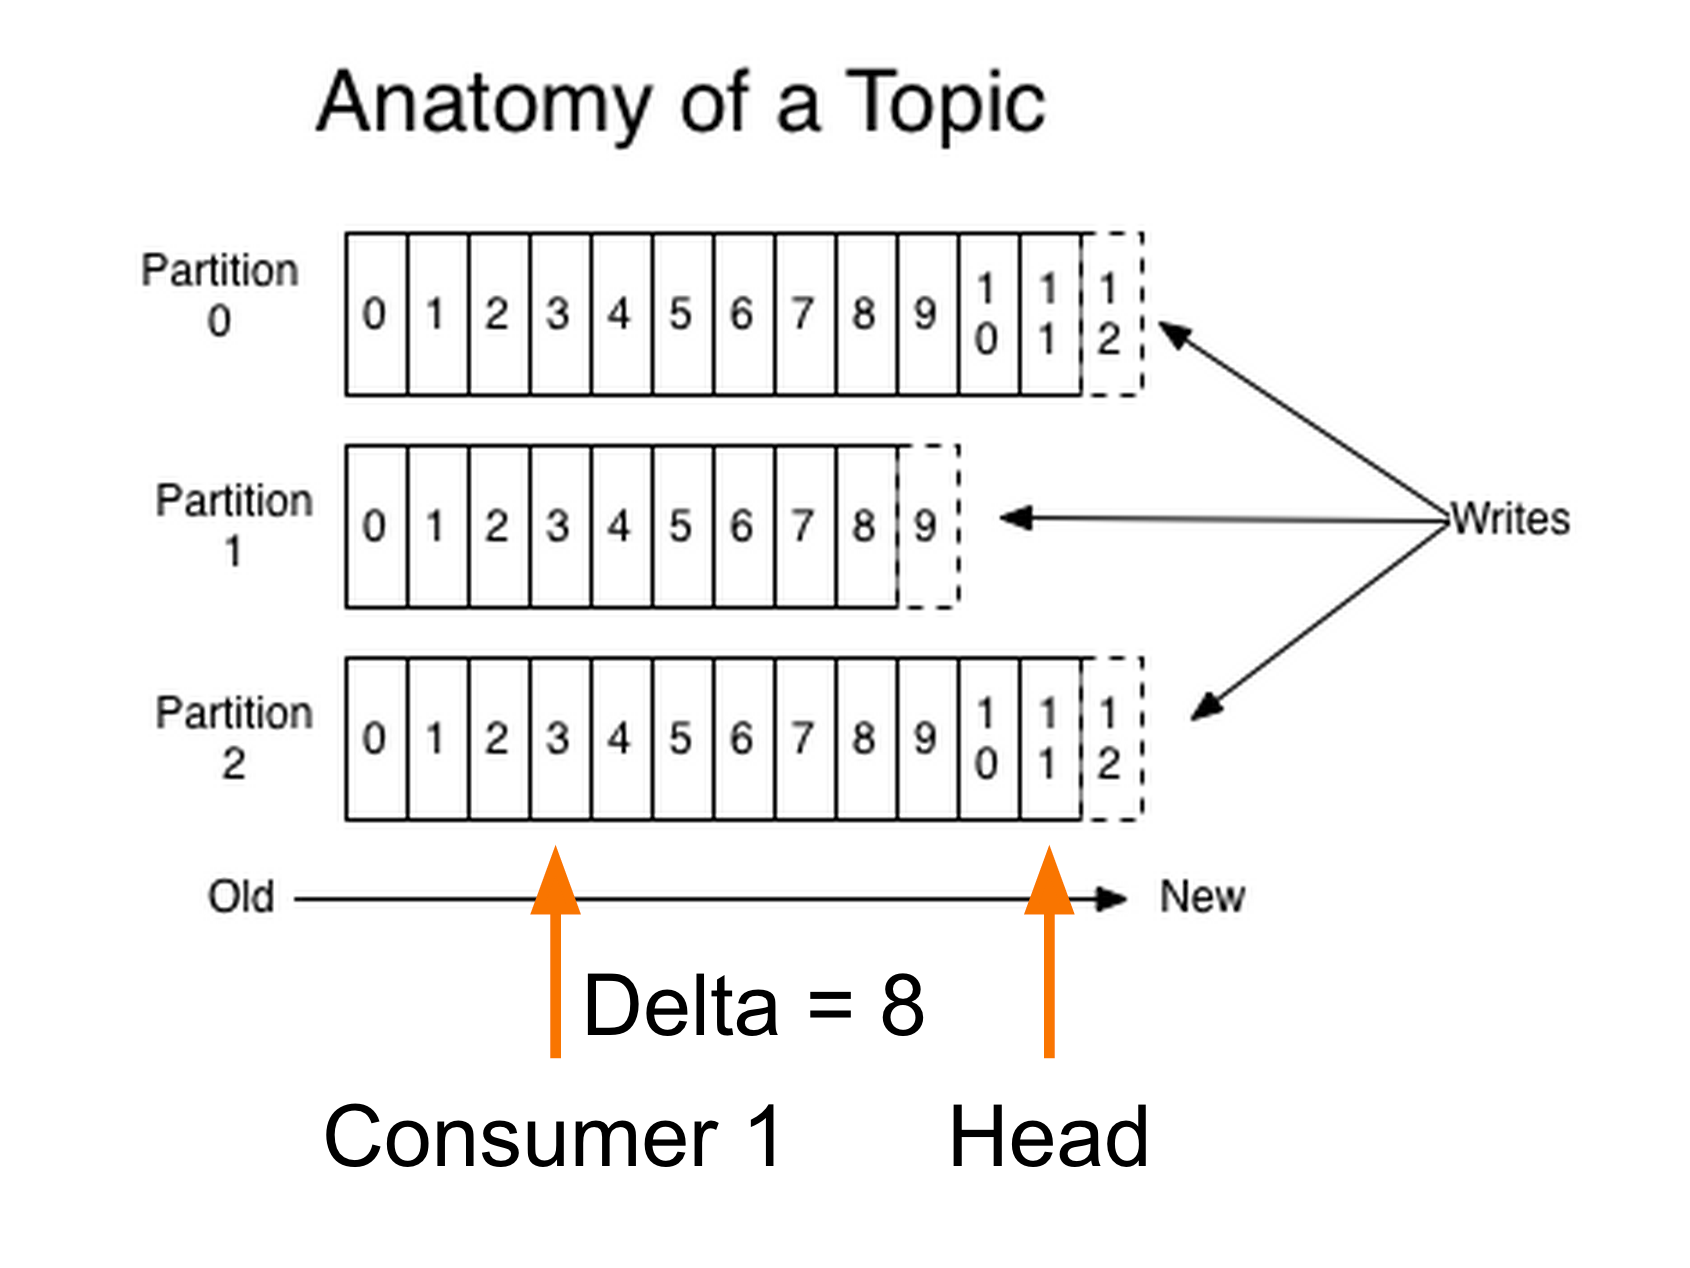
Simply put, this number represents how far behind a consumer is.
For every Kafka consumer, we track two different delta numbers: max delta and total delta. Max delta represents the single highest delta for any partition, and total delta is the sum of the deltas for each partition.
What is each good for?
Total delta tells you a lot about your consumer group as a whole. If your total delta is continually increasing, then your consumer isn’t keeping up with traffic on the topic. It’s either too slow or the volume of data is too large. In the example above, by far the slowest worker is the “Activity Writer”, it handles writing all of our Sidekick activities to HBase, so when we have issues with HBase, processing slows for all workers in a group, the total delta increases, and our monitoring system generates an alert. If you are having total delta problems, think about scaling up your consumer, or parallelizing it to get higher throughput.
Max delta is slightly harder to interpret, but generally points to a more contained issue with a single worker or partition in the consumer group. If max delta is increasing, you may have a problem in just one worker, or you may have unbalanced partitions causing one worker to receive too much data.
In addition to delta we have a concept called “lag” which helps us monitor delay in our systems when processing messages. Lag monitoring is slightly more complex (and much more application specific) than delta monitoring. A quick Google search defines lag as:
"a period of time between one event or phenomenon and another."
The events you want to measure lag between is very much up to you.
In the Sidekick example above, we monitor a few different kinds of lag by storing timestamps on all of our messages. We monitor total lag, which is the time between when an event was created and when the notification is sent. Total lag helps us monitor the whole pipeline:
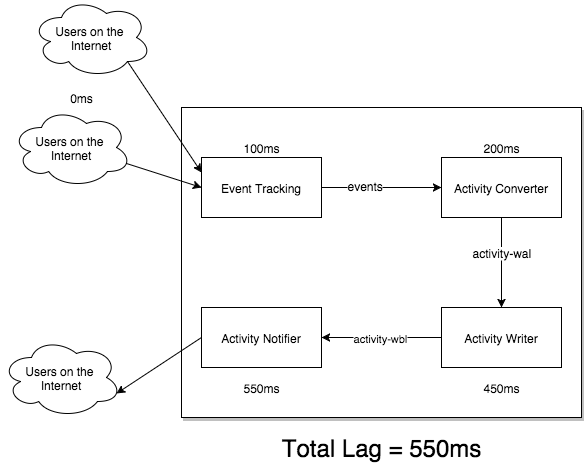
(Note: These numbers are made up for the purpose of this example.)
But we may also want to monitor lag for just one consumer, in this case we attach a “processed” timestamp to our messages to get a result more like this:
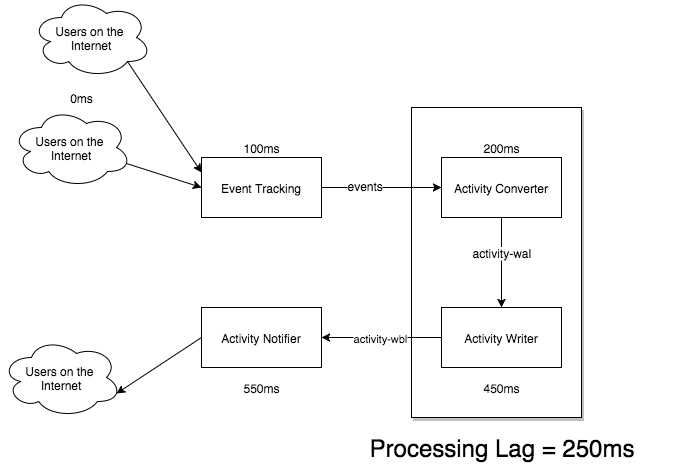
Total lag tends to be a more useful metric for alerting on, and monitoring, while more granular processing lag is helpful for debugging purposes when your total lag starts going off the chart.
Lag is very personal because you have to figure out what numbers are important for you and your system. If it isn’t time-sensitive you may decide to not alert on lag at all.
Neither delta nor lag alone can provide a complete picture of the health of your system. However, combined lag and delta make a really powerful tool for debugging complex Kafka set ups. When something goes wrong with a consumer, the first thing I do is refer to is this beautiful chart:

This framework is very useful for pointing you in the right direction when debugging issues. When the total lag for Sidekick notifications is spiking and you are being woken up to fix it, being able to quickly eliminate possible causes can be hugely helpful. Trust me, I know.
Systems like this can get complex and hard to debug quickly, and it’s important that we have the knowledge and tools to help us understand them. Monitoring delta and lag (and you already have a monitoring system, right?) are simple ways to be confident that your application is reliable and performant, and help you fix issues when it isn’t.
If you are interested in Kafka or real-time data processing in general, stay tuned by subscribing to the blog as we'll be taking a deeper dive into our Kafka infrastructure in future posts.
If you're local to Boston, make sure to sign up for The Data Metamorphosis: Boston Kafka Night here at HubSpot on Monday Oct. 5th, 2015.