A Beginner’s Guide to Building Your First Personal Programming Project
Over six thousand. That’s how many internship and co-op candidates we review every year for HubSpot’s Product & Engineering team. We seek a ...
In the field of User Experience (UX) Research, we apply a lot of rigor and methodology to designing and executing research projects, but often not as much on how to analyze our results. On paper, the “synthesis” phase can sound very simple. You just review your findings and come up with major takeaways to incorporate into your work.
But in reality, this stage is very complex, arduous, and time consuming. And it’s far too easy to introduce our own biases. When we introduce our own assumptions and predictions to our research synthesis, we put the validity of our findings at risk.
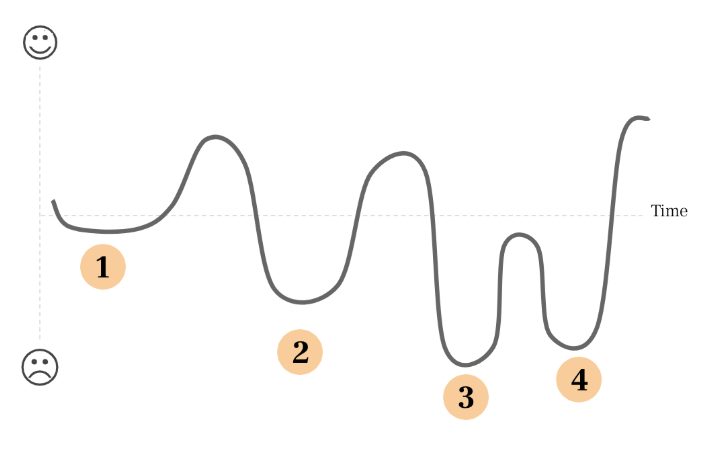
I think of research synthesis as a series of waves, with relatively predictable highs and lows. This helps me prepare for the natural low points in the process and to carve a path out to minimize error or bias. The synthesis wave is based on the startup lifecycle, a model developed by Paul Graham of Y Combinator that shows the natural highs and lows of working in a startup.
The four stages in the synthesis wave are:
It’s the third stage, insight identification, that’s most challenging for many UXers. So that’s the stage I’m going to explore in this post.
It’s far too easy—and common—to speed things up at this stage and just go with the surface level patterns you’ve identified in the Affinitizing phase. But I’ve found that you can push those surface level findings into much deeper insights with just a few simple tricks.
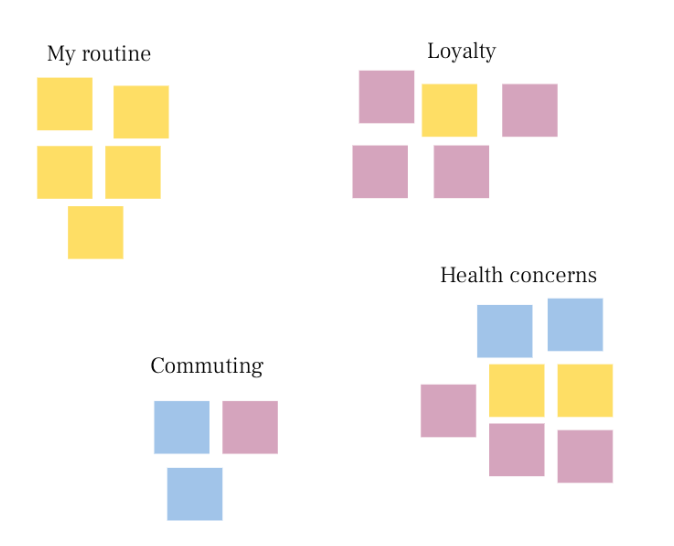
Imagine we’ve just finished a hypothetical research project where we observed and spoke with people who drink coffee.
After we finished affinitizing our notes, we found the following high level themes surfaced throughout our research:
Looking at these themes, it’s hard to know just what to do. This is where I’ve learned to spend a little more time and start to dig deep.
One of the first things I do is come up with different spectrums that relate to my initial themes and common topics. Then, I map the different findings onto these spectrums. Since I take all of my notes on color-coded sticky notes during the Externalization phase, this makes my process very easy to visualize as I start identifying insights.
Looking at our different themes and findings, we might come up with a few different spectrums for our coffee project.
For example:
I’ll typically draw the spectrums on a whiteboard and start moving stickies to see where they fall onto the spectrum. Often in this type of research, I’ll have done research with a couple different segments or cohorts of people. It’s helpful to have the sticky notes color-coded by each segment, so that I can see holistic patterns when I look at multiple spectrums. But if I were only working with one group, I’d try to give each participant their own color sticky.
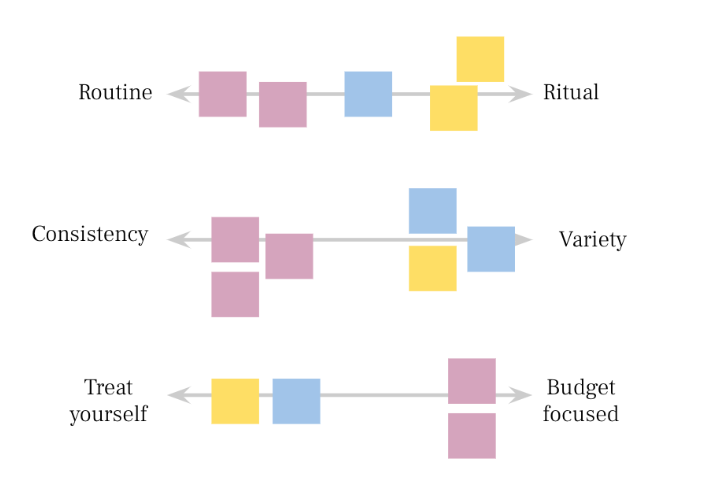
Let’s imagine in our research project, we saw that the same people who fall on the “Consistency” side of the “Consistency ← → Variety” spectrum also fall on the “Budget-focused” side of the “Budget-focused ← → Treat yourself!” spectrum. By looking at those types of patterns, we can start to see patterns and identify new segments of people based on traits we might not have otherwise noticed.
If you find these types of patterns emerging, you might find it natural to put together examples of proto-personas, where you flesh out the defining attributes across your different research samples.
If you don’t find these types of patterns emerging, that is also okay. It might just be that you didn’t encounter different clusters of behaviors within your sample. Instead of trying to make connections where they don’t exist, take a break from the spectrums and think of another way to organize your data.
In general, I’ll try to re-organize my data into two or three different ways for each project.
Depending on your unique research project, different frameworks for visualizing your data can serve different purposes.
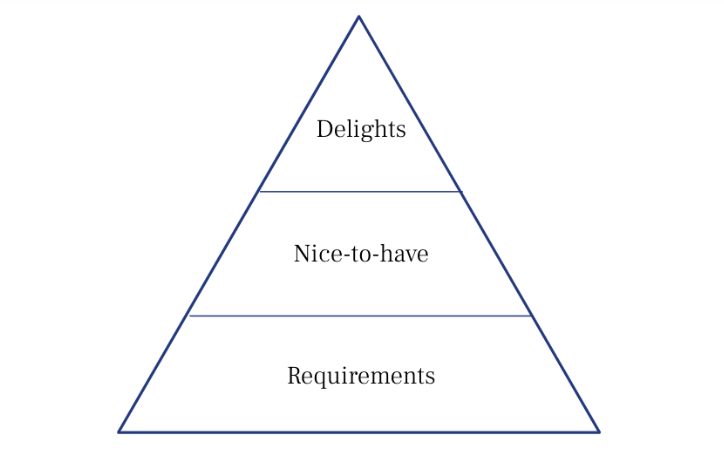
Now let’s say we noticed the theme of “Loyalty” was particularly interesting, and had a lot of different angles and nuances to offer. Looking at our notes for just that one theme, we might find it helpful to organize the subfindings into a hierarchical diagram. Picturing Maslow’s hierarchy of needs, we can ask ourselves, what are the minimum requirements for someone to be loyal to a certain coffee shop or product? What attributes are secondary? What are their ideal “nice to haves” that come last?
Or if our data was more scattered across multiple themes, we might come up with a framework to study the relationship between a couple themes. For example, we might try to put our findings from “Loyalty” and “Commuting with coffee” into a Venn diagram and see where they overlap.
Throughout this process we’d keep an open mind, and come up with new frameworks that are suitable to our specific findings.
The point is not to force your findings into a predefined framework, but rather to look at your findings and see what framework comes naturally.
Depending on your research methods and focus areas, the way you visualize the data can be very different.
Consider how other research examples might be suited to other frameworks. If during the research we followed people throughout their entire morning routine, you might see how those findings would fit nicely into a journey map. However, if our research consisted of people describing their favorite coffee shops, a journey map might not fit the data we collected.
As you become more familiar with this practice, you’ll naturally gravitate toward certain frameworks. When you find yourself relying on the same tricks, I encourage you to challenge yourself to incorporate something new. By avoiding developing habits in this phase, you can reduce the influence of your own natural biases. Instead, push yourself to find another method to organize the data and see if that surfaces a different perspective or pattern.
What happens when you feel stuck, and don’t immediately see a framework that suits your research? Consider setting up a mood board to capture inspiration from other places. I often look for inspiration from unique quantitative data visualizations, and browse the Google Slides “Diagrams” feature to look at different models.
Or, you can do yourself one better and involve your whole team. Show your process to a coworker and see how they might reorganize the data in a different way. I’ve found that at this stage in synthesis, it’s helpful for me to do a “mini share-out” with my stakeholders. I’ll show them a very messy whiteboard with a few frameworks or categorized sticky notes, and have them ask questions and poke holes in my story. By bringing in these fresh perspectives, I can surface assumptions that I made without even realizing it.
As with any new skill, the more often you incorporate these practices into your method, the more confident you will feel changing and adapting them to suit your own needs. By following these guidelines and building more meaningful synthesis time into your research efforts, you can reduce the influence of your own bias and ensure your results are truly impactful.