Day in the Life: Nina Castillo
Meet Nina Castillo, an Associate Product Management (APM) Intern at HubSpot who has spent her internships learning about the world of Product ...
Data can often go beyond just reporting by enabling others through interactive self-service tools. Additionally, these tools can improve the development process and influence the product & engineering roadmap by providing a proof of concept. This solves challenges with gaining timely insights, prioritizing new product features, and improving inefficient processes.
Analytics can come in so many different flavors depending on the team and the problems they’re looking to solve. A general approach an analyst may have is the fundamental practices of reporting, telling a story, and recommending action items. However, operational inefficiencies around data practices persist in today's organizations. Knowing what/where/who to ask, and waiting for someone to take action on your request, can result in a lengthy process that returns an answer to a (now) irrelevant question. Speed–to-delivery and removing information silos are a great way to utilize advancements in infrastructure.
The best way to democratize data is through interactive self-service tools which can be made possible through Snowflake, DBT, and Looker. Flexible tools can allow end business users to conduct their analysis with dynamic inputs instead of depending on static one-time deliverables.
A HubSpot Example: Problem & Solution
Operations teams and go-to-market teams, like marketing, were interested in taking action based on CRM insights. Common questions we heard included:
As you can imagine, there is a lot of data in this space, especially when we're talking about different systems, sources, and billions (yes - you read that right) of rows. The types of questions we are asking here aren't necessarily new, and user research with our customers showed they also had the same sorts of questions. Crafting the right solution at scale for all to use, including our customers, is quite the challenge. It takes building a new team, hiring, training, onboarding, and most important of all, it takes time. This can be especially painful when the challenge persists in the current day-to-day.
That's where data democratization, specifically the creation of interactive self-service tools, can provide value. Analysts are well-equipped as subject matter experts in this space, and there's no need to be a full-stack engineer with extensive experience to create a platform that'll scale with thousands of users. The benefit here for a data analyst is that the key need involves metrics. You can get the job done with the help of Snowflake, DBT, and Looker.
After conducting internal user interviews, shadowing teammates in their day-to-day workflows, and collecting more requirements, we understood the specifics around what would benefit them most. Then, we created transformations and scheduled jobs using DBT in our Snowflake warehouse. DBT allowed us to build rapidly, cutting down on development time, and created net-new data assets with proper documentation that other analysts could utilize as well. Then, we brought this data into Looker by introducing new explores. Lastly, we visualized this data in a dashboard, emphasizing filters and parameters where users can dynamically input what they're interested in to manipulate the output. The end result was a collection of Looker dashboards that were consistently updating, which any user could access and even stylized (with the help of HTML) to look similar to our existing products.
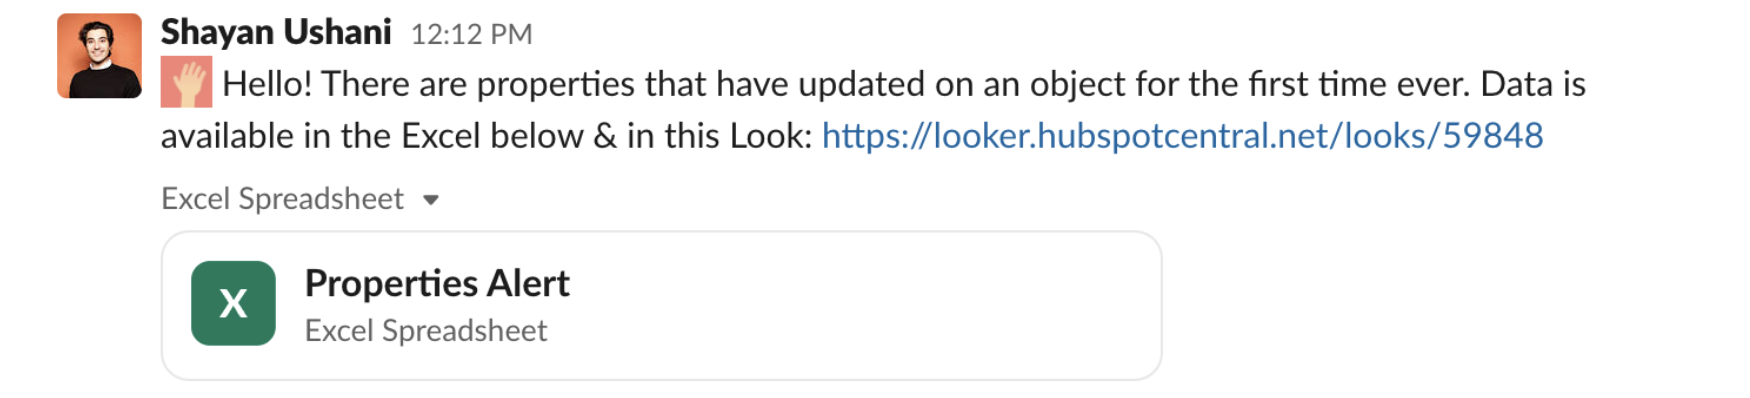
If you want to see what properties haven't been updated in X number of months and, in turn, get the list of people, departments, and emails using these outdated properties, you can do all of that and more. Additionally, we have flexibility in adjusting these tools and adding even further functionality such as alerting and monitoring. You can set up rules and get a custom Slack message in something you're interested in.
All of this is possible without knowing how to code, as shown in the image below. The sender here is me, but this is a wholly automated message that needed no manual intervention.
Improving the Product & Engineering Development Process
A great development process is one in which feedback is integrated in the roadmap to continuously iterate and stay close to the problem. Here's where interactive tools like the example mentioned above can help. They allow the business to access tools without the cost and time needed to get product management and engineering involved. This way, they also act as an MVP or proof of concept. What better way to create a polished product than having something users can play around with, provide feedback, and communicate recommendations? Creating these functional data tools can lead to a virtuous cycle where the business can reap the benefits while also passing down learnings to product and engineering teams. Something fungible can strike a chord harder than an idea or wireframe.
The specific question in our example above is part of a more comprehensive solution our customers are interested in. Here's how Jeff Vincent, Senior Product Manager, used one of the interactive dashboards we built with his team:
-2.png?width=710&name=Name%20Dropping%20(2)-2.png)
Eliminating Friction in Processes to Promote Nonlinear Growth
Analysts are often approached with problems that aren't necessarily related to a tangible product. Sometimes a problem is a closed box question. For example, we are looking to understand the conversion metrics on a shopping cart button. However, many circumstances call for a solution in increasing the effectiveness of workflows.
Eliminating friction in processes promotes non-linear growth that can have gains throughout the entire company. If you discover a way to improve go-to-market teams’ day-to-day and develop a tool that allows them to act just 1% faster, the compounding effect serves as a catalyst for sustained growth. In our example above, the persona we are solving for involves multiple operations admins that previously had to spend hours getting the data they needed, asking around, throwing questions in Slack channels, and waiting for the turnaround by an analyst. Now they're saving time and can focus on larger business value tasks.
Final Thoughts
Approaching data problems with a product framework, like in the example, has several benefits, including:
Next time you hear of a pain point and question that seemingly pops up repeatedly, think about how you can utilize these learnings to take your team to the next level.
Interested in working on a data-driven team with high-impact opportunities at a company growing at hyper-scale? Check out our open positions and apply.