Embrace and Replace: Migrating ZooKeeper into Kubernetes
We recently migrated hundreds of ZooKeeper instances from individual server instances to Kubernetes without downtime. Our approach used powerful ...
Big Data gained a lot of traction during the past ten years. You might have already heard about the MapReduce algorithm, seen the Apache Hadoop elephant or used a Hadoop Distributed File System (HDFS) yourself.
If you’re looking to learn more about Big Data, you’ve come to the right place. This article is an introduction to a series of upcoming blog posts covering popular Big Data services used at HubSpot and across the industry, such as Yarn, Zookeeper, HBase, Kafka, Spark, and Presto, brought to you by the Email Analytics team at HubSpot.
In this article, we’ll take a closer look at the foundations of Big Data and the use cases we have at HubSpot. We will cover the basic definition of Big Data, the secrets of scalability, and challenging analytics use-cases such as event processing and interactive analytics.
Here at HubSpot, we use Big Data services to power many different parts of our product and to support data storage, processing, and analytics at scale. But what does this actually mean?
Before we jump into discussing the foundations for Big Data systems and Big Data Analytics, it might be useful to refresh the definition of Big Data. This will help you to identify when you are dealing with Big Data and choose the correct tools for your use case.
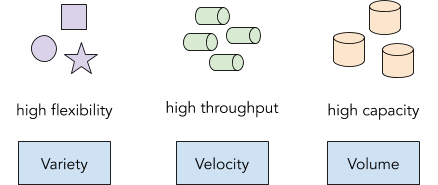
While the term Big Data is often used as a synonym for large scale data storage and processing systems, its formal definition is very concise. Hence, before speaking about Big Data, it’s always handy to recall this definition, also called the 3Vs of Big Data:
Data should be classified as Big Data if it is of high volume, high velocity, and/or high variety.
Volume describes a large amount of data you want to store, process or analyze. In 2020, this amount could be anything from multiple GBs to TBs and PBs of data. Here is a good rule of thumb: If your data is growing by at least multiple GBs per day, you are dealing with Big Data.
Velocity means a high data throughput to be stored, processed or analyzed; often a large number of records over a short period of time. In 2020, if you're processing thousands of records per second you might already be dealing with high velocity.
Variety stands for the large amount of different data types and formats that can be stored, processed or analyzed. Different data types including binary, text, structured, unstructured, compressed, uncompressed, nested, flat, etc. should be processed and stored using the same system. However, data variety is often a consequence of Big Data rather than a requirement.
A great example for variety is the highly scalable storage system HBase. It’s a distributed key-value datastore where both keys and values are simply byte arrays. The encoding is done in the application rather than the storage layer. Therefore it is often used to store images, audio, compressed data, json documents, or any type of encoded or raw data. At HubSpot, we store much of our application data encoded as Protocol Buffers in HBase.
To recap, Big Data systems are systems to handle data of high volume, high velocity, and high variety; these systems are usually distributed systems that allow us to store and process data that requires high flexibility, high capacity and/or high throughput.
Other definitions for Big Data vary slightly. You will find definitions with 4 or even more Vs, such as Veracity for example. Veracity refers to the trustworthiness of the data and hence describes how useful your data actually is. While these extended definitions are relevant aspects for Big Data, they don’t necessarily turn data into Big Data.
Let’s take a look at how we can scale a system to handle Big Data!
Big Data systems are distributed systems that allow for storing, processing and querying data of high volume, high velocity, and/or high variety. However, it’s a lot more intuitive to turn this statement around. In order to store, process, or query data of high volume, velocity, and variety, you need a distributed system.
Let’s look at one example from the Email Analytics team at HubSpot. In order to perform analytics on email events data, we need a system that can handle the throughput of more than 30k messages per second (high velocity). The following figure shows a typical week of incoming event data to our analytics pipeline.
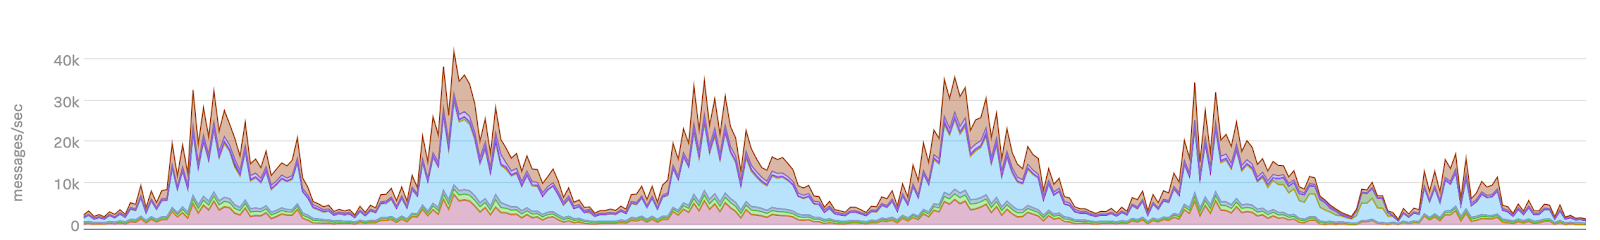
Events in a Kafka topic
Once the data is processed (cleaned, transformed, enriched, etc.) we need to persist the data for other consumers, such as customer-facing web services and internal applications. In total, we store 260TB of compressed event data (high volume) while supporting more than 30k writes and 100k read requests per second (high velocity). The following figure shows a snapshot of one of our event datastores.
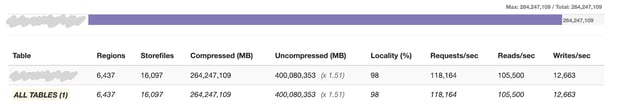
Events in an HBase table
As you can see, both use cases require high scalability and high throughput. Ideally we would like to scale the system linearly — for example, doubling the amount of nodes to double the throughput or double the storage capacity. This is also called horizontal scaling as opposed to increasing CPU, memory, and disk size of individual machines (vertical scaling). Most Big Data systems and frameworks such as Hadoop Distributed File System and MapReduce have been built to allow for horizontal scaling for linear scalable data storage and processing.
At HubSpot we extensively use Hadoop and Spark for data processing as well as Kafka for scalable message queuing and HBase for efficient data storage. In order to handle the increasing amount of data, write and read requests, we split all messages into multiple partitions using a partition key. The data is then distributed over multiple nodes as shown in the following figure.
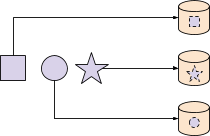
Partitioning allows for high write throughput
In HubSpot, all data can be naturally partitioned by the HubSpot account id because the data will always be accessed by account. Within Email Analytics, most events can also be partitioned by email recipient or a Marketing Email campaign id. By partitioning the data we can distribute the write traffic across all nodes and hence achieve higher overall write throughput than on a single node system. Most Big Data systems handle partitioning out of the box as it is a requirement for horizontal scalability.
Partitioning allows us to distribute data across multiple machines and hence allows for horizontal scalable systems. However, in order to increase availability and read throughput to multiple 100k per second we also need to use replication. By replicating partitions across machines we ensure that the same data is available on multiple machines. Hence, services can consume the data at the same time from different machines which allows us to scale read throughput.
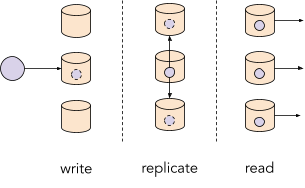 Replication allows for high read throughput
Similar to partitioning, replication is a core technology of most Big Data systems and is often used to ensure availability and high read throughput. However, it’s worth mentioning that using partitioning and replication to improve throughput and fault tolerance comes at a high cost: namely, data consistency. This problem is better known as the CAP theorem, which limits consistency and availability of any distributed system.
Big Data systems are often used for data storage, querying, or data processing. These use cases can be categorized into two types depending on the write and read patterns: Online Transactional Processing (OLTP) and Online Analytical Processing (OLAP).
OLTP-optimized query and storage systems such as HBase, Cassandra and Kafka are great for writing and reading individual records or small batches of records at a time. Stream processing systems such as Storm, Spark Streaming, Kafka Streams, or Flink that are used for per-record transformations and real-time (temporal) aggregations are also good examples for OLTP. In Email Analytics, we use OLTP systems for processing transactional events in our real-time data pipeline such as reading, writing, and updating the current state of an email send attempt.
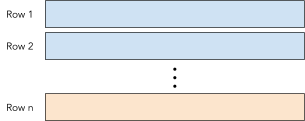
OLTP system optimized for reading/writing individual rows
As OLTP systems are row-encoded, they are optimized for reading and writing individual rows. This is also what most relational databases do.
OLAP systems such as PIG, Hive, Impala and Presto (when combined with Parquet, Arrow, ORC, etc.) on the other hand, are optimized for writing, reading and aggregating data from individual columns across many rows efficiently. They are often used for data warehousing, data analytics, and batch processing systems. In Email Analytics, we use OLAP systems for querying and aggregating event statistics such as the open rate of an email campaign for a specific group of contacts.
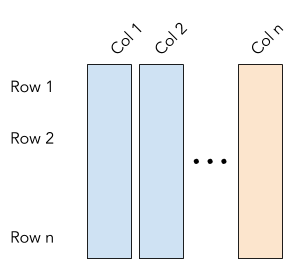
OLAP system optimized for reading/aggregating individual columns
In contrast to row-encoded OLTP datastores, OLAP systems use column-encoded file formats and hence are optimized for reads and aggregation of individual columns over a large amount of data. Many classical data warehousing systems such as Teradata or Oracle use this technology as well.
It’s worth mentioning that some Big Data systems such as Druid cover both areas by providing high-throughput writes of individual records while enabling efficient OLAP-style queries through continuous file compaction. However, as implied in the CAP theorem, there is no silver bullet for Big Data and each system has its own tradeoffs.
Let’s take a look at the most common analytics use case.
Big Data systems are used to store, process, and query massive amounts of data, mostly batch and stream processing using OLTP or OLAP-based processing techniques. Let’s drill into the use case for analytics by looking at four different use cases of increasing difficulty in Big Data analytics:
The simplest and most common use case for Big Data analytics is processing of historical data, also known as reporting. In reporting we usually perform a relatively small number of long-running scheduled jobs that aggregate data stored in Big Data systems. A typical question to answer with reporting could be how many emails did HubSpot customers send in the past year using Starter, Professional, or Enterprise Marketing Hub tiers?
In reporting, it is common to normalize your data into numerical transactional records — also called measures or facts — and dimensions containing aggregation keys (common examples are Star schema, Snowflake schema or Data Vault modeling). While this helps to model historical data of well-defined schemas, it requires joining data at query time. In Big Data, complex joins involving network shuffles are the most expensive operations and hence reporting queries are typically slow. A query often takes longer than one minute to finish.
The second most common use case in Big Data analytics is real-time event processing, often referred to as stream processing or stream analytics. In stream analytics, we extract and aggregate data over a short amount of time to compute real-time insights. A typical example of real-time stream analytics is Bot detection on email events. We do this by analyzing all email events such as sends, opens, and clicks of a recipient in a short time window (e.g. five minutes) and identifying abnormal behavior and anomalies.
The third application in Big Data analytics is a combination of both previous methods, namely real-time interactive analytics. Interactive analytics is like reporting with real-time data ingestion and response times of less than one second. To achieve better query performance, data for interactive analytics is often denormalized. Good examples for interactive analytic use-cases are evaluating the number of recipients in a dynamic list ahead of sending an email campaign — including real-time properties such as recipient bounces, graymail suppression, and other dynamic properties.
Another important application for Big Data analytics is behavioral modeling and forecasting. For this use case, we analyze the past to build a model that can predict the future. We often use heuristics, statistical methods (such as Linear Regression, Logistic Regression, etc.) as well as Machine Learning techniques (such as SVM, Gradient Boosted Trees, Deep Learning, etc.). A typical practical example is forecasting the amount of email campaigns for the next Black Friday weekend, classifying out-of-office replies or computing the best time for a recipient to receive an email.
In Email Analytics at HubSpot, we are currently working on many of these use cases to help our customers send better emails and grow better.
To recap, we've seen that storing, processing and querying Big Data requires horizontally scalable distributed systems that let you process 100s of GBs of data and 10s of thousands of messages per second. We've talked about data volume and throughput, and how partitioning and replication allows for horizontal scalability. Depending on the use-case we choose OLTP and OLAP engines to answer some of the most complex customer questions at HubSpot.
While we are working on the next article in this series — Introduction to Hadoop, from MapReduce to Spark — you can check out this video of Kafka Night at HubSpot about Confluent and HubSpot on Real-Time Data Processing.
An earlier version of this post appeared on Christoph's blog.